
Implied Volatility (IV) Guide: When to Buy Options Low and Sell Them High
Unlock the secret to timing options trades with IV. Learn how to spot low-IV buying opportunities, high-IV selling setups, and avoid costly volatility traps.
OPTIONS TRADING
Ben T.
12/10/202521 min read

The Hidden Timing Signal Most Traders Ignore
Options traders obsess over strike prices and expiration dates, but the most powerful timing signal often goes unnoticed: implied volatility. Understanding when IV is statistically cheap or expensive transforms options trading from guesswork into strategic decision-making. This single metric reveals precisely when to buy and when to sell.
Introduction
Implied volatility represents the market's collective expectation of future price movement, yet it remains one of the most misunderstood concepts in options trading. Novice traders often interpret high IV as a signal of guaranteed directional movement or mistake low IV for safety. Neither assumption is correct. IV measures expected range, not direction, and certainly not certainty.
The critical insight separating profitable traders from those who struggle is this: IV's relative level—compared to historical norms—determines whether an option contract is statistically cheap or expensive. This comparison provides the foundation for optimal timing. When you master the relationship between IV and premium pricing, you gain the ability to systematically buy options when they're undervalued and sell them when they're overpriced. This article provides the professional-grade frameworks you need to identify these opportunities, execute them correctly, and manage the inherent risks.
What Implied Volatility Actually Represents
Implied volatility is the value that must be inserted into options pricing models to produce the option's current market price. Rather than being calculated from historical data, IV is derived backwards from the actual premium traders are willing to pay. It represents the market's forward-looking expectation of price movement magnitude over the option's life.
The Probability Distribution Concept
IV reflects market uncertainty about future price action. When IV is high, the market anticipates a wide potential price range by expiration. This expanded probability distribution means the underlying security could reasonably land far from its current price—in either direction. High IV signals elevated uncertainty, not predicted direction.
Conversely, low IV indicates the market expects modest movement. The probability distribution narrows, suggesting the underlying will likely remain closer to its current price through expiration. This constrained range reflects market consensus that significant movement is unlikely.
Critical clarification: High IV does not guarantee a large move will occur, nor does it indicate which direction that move might take. It simply means the market is pricing in the possibility of substantial movement. Similarly, low IV doesn't guarantee stability—unexpected events can still drive sharp price changes even when IV suggests calm conditions.
IV vs Historical Volatility
Historical volatility (HV), also called statistical volatility, measures actual past price movement using quantifiable data and mathematical formulas. It looks backward, calculating how much the stock has moved based on closing prices over a specific period.
IV, in contrast, looks forward. It captures the market's collective expectation of volatility based on supply and demand for options contracts. Two stocks with identical historical volatility can have vastly different implied volatility levels if market participants expect different futures. A stock that has traded quietly for months might suddenly show elevated IV if an earnings announcement or regulatory decision approaches.
This forward-looking nature makes IV the more valuable metric for options timing. While HV tells you what happened, IV tells you what the market expects to pay for future uncertainty.
How IV Changes Option Prices
Options premiums consist of intrinsic value and extrinsic value. Intrinsic value reflects how much the option is already in-the-money. Extrinsic value, also called time value, represents the premium paid for the possibility of favorable movement before expiration. Implied volatility primarily drives this extrinsic component.
The relationship is straightforward: higher volatility expectations mean higher option prices. When IV rises, premiums expand. When IV falls, premiums contract. This occurs regardless of the underlying stock's price movement.
Vega: The Measure of Volatility Sensitivity
The option Greek Vega quantifies how much an option's price changes for every one-point change in implied volatility. If an option has a Vega of 0.30, a one-point increase in IV will increase the option's value by approximately $0.30 per share, or $30 per contract.
Vega is typically highest for at-the-money options and decreases as options move further in or out of the money. It also declines as expiration approaches, since there's less time for volatility to impact the outcome.
Understanding Vega is essential because it reveals how much of an option's price derives from volatility expectations versus other factors. An option with high Vega will experience substantial price swings purely from IV changes, even if the underlying stock price remains flat.
Premium Expansion and Contraction in Action
Assume a trader purchases an at-the-money call option on a stock trading at $100. The option trades at $4.50, with IV at 30% and Vega of 0.50.
If market uncertainty increases—perhaps due to upcoming regulatory news—and IV jumps from 30% to 35% (a five-point increase), the option's theoretical value increases by 0.50 × 5 = $2.50 per share, or $250 per contract. The option would now be worth approximately $7.00, assuming the stock price hasn't moved.
Conversely, if IV collapsed from 30% to 20% following the news release (known as IV crush), the same option would theoretically lose $5.00 per share, or $500 per contract, dropping to approximately $2.00 even if the stock price remained at $100.
This example illustrates why IV, not just stock price movement, often drives the profitability of options trades. Premium expansion from rising IV can generate profits even without favorable price action. Premium contraction from falling IV can erase gains even when the stock moves in the desired direction.
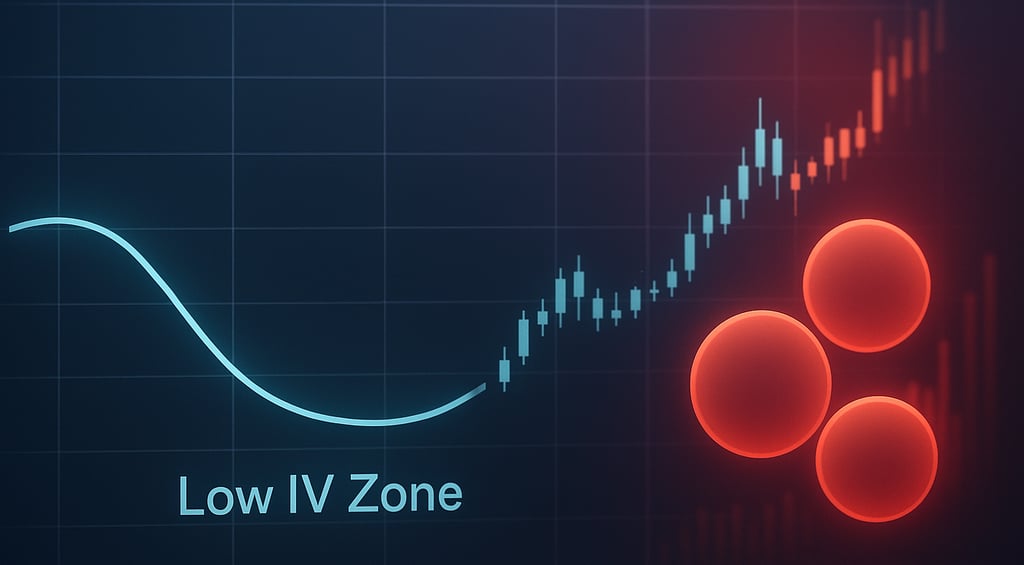
When to Buy Options (Low IV Environments)
The principle is foundational: buy low, sell high. For options traders initiating long positions, this means purchasing contracts when implied volatility is relatively low compared to historical norms. Low IV corresponds directly to statistically cheaper premiums.
When you buy options in quiet periods, you position yourself to benefit from volatility expansion. If IV subsequently increases, your options gain value from positive Vega exposure, independent of directional movement. This dual path to profitability—price movement and volatility expansion—provides significantly better risk-reward dynamics than buying expensive options during high IV periods.
Why Low IV Equals Opportunity
Low IV environments reflect reduced market uncertainty and muted expectations for significant price movement. This consensus creates underpriced options, as the market isn't demanding high premiums for perceived risk. When IV is compressed, you're essentially buying insurance at discount rates.
The strategic advantage becomes apparent when volatility inevitably expands. Markets don't remain calm forever. When uncertainty returns—whether from earnings, economic data, geopolitical events, or technical breakouts—IV rises, inflating premium values even before the underlying moves substantially.
Best Strategies in Low IV
Directional strategies thrive when initiated during low IV periods:
Long Calls and Long Puts: These straightforward positions provide leveraged exposure to anticipated price moves. The low cost of entry maximizes profit potential if your directional thesis proves correct. Long calls profit from upward price movement, while long puts profit from declines.
Debit Spreads: Strategies like bull call spreads or bear put spreads offer defined-risk exposure with lower capital requirements. By simultaneously buying one option and selling another at a different strike, you reduce the net debit paid while maintaining directional exposure. These spreads work particularly well in low IV because the premium collected from the short leg offsets less of your long position's cost, preserving more upside potential.
Detecting Quiet Volatility Pockets
Technical indicators can help identify low IV environments:
Bollinger Bands visibly contract during periods of declining volatility, creating what traders call a "squeeze." The bands hug price action tightly, reflecting diminished trading ranges. These compression periods often precede significant breakouts, as markets tend to alternate between consolidation and expansion. The squeeze signals that options are cheap and a volatility expansion may be imminent.
IV Percentile and IV Rank (discussed in detail later) provide objective measurements of current IV relative to historical ranges. When these metrics fall into the bottom 20-30% of their range, you've identified a statistical low-volatility pocket.
Risk Considerations of Buying in Low IV
The primary risk facing long options positions is time decay, measured by the Greek Theta. Every day that passes reduces the option's extrinsic value, with decay accelerating dramatically in the final 30 days before expiration.
If the underlying security remains range-bound or moves too slowly, time decay can erode the entire premium even if your directional thesis eventually proves correct. An option that expires worthless delivers a 100% loss regardless of how close the stock came to your target.
This risk intensifies with at-the-money options, which hold maximum extrinsic value vulnerable to Theta. To mitigate this, avoid buying options too close to expiration unless you expect immediate movement. Provide adequate time for your thesis to develop, typically selecting contracts with at least 45-60 days until expiration for standard directional trades.
Additionally, recognize that low IV doesn't guarantee subsequent expansion. Some stocks maintain persistently low IV during long periods of quiet, range-bound trading. Without volatility expansion or significant directional movement, long options positions will lose value steadily through time decay alone.
When to Sell Options (High IV Environments)
The opposite side of intelligent options timing involves selling contracts when implied volatility is elevated. High IV inflates option premiums, creating statistically expensive contracts. Options sellers capitalize on this by collecting inflated premiums, then profiting as extrinsic value decays through time and volatility contraction.
When you sell options during high IV periods, you're effectively selling insurance at premium rates. The market is paying elevated prices for protection against uncertainty. Your objective is to collect that premium, then benefit as uncertainty resolves and premiums return to normal levels.
Why High IV Creates Selling Opportunities
Elevated IV dramatically increases the extrinsic value component of options premiums. This inflated time value represents the market's willingness to pay for potential movement that may never materialize. Most options expire worthless or with minimal intrinsic value, meaning sellers who collect high premiums during IV spikes capture value that typically evaporates.
The subsequent decline in IV following anticipated events—known as IV crush—accelerates premium depreciation beyond normal time decay. This double erosion (declining IV and declining time to expiration) works powerfully in favor of options sellers.
Events That Drive High IV
Implied volatility typically spikes before scheduled, high-impact events:
Earnings announcements create maximum uncertainty about quarterly results, revenue guidance, and forward projections. IV commonly doubles or triples in the days before earnings, then collapses immediately after the announcement regardless of whether results beat or miss expectations.
FDA approvals or rejections for pharmaceutical companies, regulatory decisions, product launches, and merger announcements all generate elevated IV as the market prices in binary outcome uncertainty.
Economic data releases such as Federal Reserve decisions, employment reports, or inflation data can elevate IV across broad market indices and sector ETFs.
Best Strategies in High IV
Credit-generating strategies that benefit from time decay and volatility contraction include:
Credit Spreads: These defined-risk positions involve selling one option while simultaneously buying another at a different strike price for protection. Bear call spreads and bull put spreads limit maximum loss to the difference between strikes minus the credit received. This defined risk makes them preferable to naked short options, especially for traders with smaller accounts or limited risk tolerance.
Iron Condors: This neutral strategy combines a bear call spread and a bull put spread, creating a position that profits when the underlying stays within a range. Iron condors benefit maximally from theta decay and IV crush while defining maximum loss on both sides.
Short Strangles: Selling both an out-of-the-money call and an out-of-the-money put generates substantial premium in high IV environments. This strategy profits when the underlying remains between the two strikes, though it carries significantly higher risk than defined-risk alternatives since losses can be substantial if the stock makes an extreme move.
The IV Crush Trap and Risk Management
While selling into high IV offers attractive premiums, directional risk remains significant. The stock can make large, sudden moves immediately following the event that drove IV higher. If that move goes against your position, losses can exceed the premium collected.
Critical risk management principles:
Favor defined-risk structures: Credit spreads limit maximum loss to a predetermined amount. Naked short options (uncovered calls or puts) expose you to potentially catastrophic losses, with naked calls carrying theoretically unlimited risk. Unless you have extensive experience and substantial capital, avoid naked positions entirely.
Size positions appropriately: Never allocate more than 2-5% of your portfolio to any single options trade. High IV strategies can generate consistent income through probability advantages, but occasional losses are inevitable. Proper position sizing ensures no single loss significantly damages your account.
Understand assignment risk: When selling puts, you assume the obligation to purchase the underlying stock at the strike price if the buyer exercises. Selling calls obligates you to sell the stock. Monitor short positions carefully as expiration approaches, particularly if the options move in-the-money.
Plan your exit before entry: Define specific conditions for closing winners (typically 50-75% of maximum profit) and stopping out losers (typically when the position reaches 200% of premium collected). Emotional decision-making destroys more accounts than directional risk.
Avoid earnings trades without experience: While selling options into earnings offers maximum premium, it also carries maximum directional risk. Many traders have been devastated by gap moves following earnings surprises. If you choose to trade earnings, start with small positions and defined-risk structures only.
IV Rank vs IV Percentile
To determine whether current implied volatility is relatively high or low, you need comparison metrics. Two primary measurements serve this purpose: IV Rank and IV Percentile. Both compare current IV to historical IV levels, but they calculate differently and serve slightly different analytical purposes.
IV Rank
IV Rank measures where current IV stands relative to its 52-week (or one-year) high and low. The formula is:
IV Rank = (Current IV - 52-week Low IV) / (52-week High IV - 52-week Low IV) × 100
This produces a percentage from 0 to 100. An IV Rank of 80% means current IV is 80% of the way from its annual low to its annual high. An IV Rank of 20% indicates IV is quite low relative to the past year's range.
Strengths: IV Rank provides an intuitive scale showing where you are in the volatility range. It works well for stocks and ETFs with consistent liquidity and regular options activity.
Weaknesses: IV Rank can be skewed by a single extreme volatility event. If a stock experienced a massive IV spike once during the year (perhaps due to a takeover rumor or unexpected news), that outlier creates an artificially high ceiling, making subsequent IV readings appear lower than they truly are in typical conditions.
IV Percentile
IV Percentile measures what percentage of days over the past year (or 252 trading days) had lower implied volatility than today. If the IV Percentile is 75%, it means current IV is higher than it was on 75% of the days in the lookback period.
Strengths: IV Percentile is less sensitive to outlier events because it considers the frequency of IV levels rather than just the extremes. It provides a more robust measure of whether current conditions are typical or exceptional.
Weaknesses: During trending volatility environments (persistently rising or falling IV over months), IV Percentile may lag in reflecting the current regime change.
Which Metric Should You Use?
Most professional traders monitor both metrics but emphasize IV Percentile for its statistical robustness. As a practical guideline:
IV Percentile below 25-30%: Consider long options strategies (buying calls, puts, or debit spreads)
IV Percentile between 30-70%: Neutral territory; choose strategies based on directional conviction rather than volatility level
IV Percentile above 70-75%: Consider short options strategies (selling credit spreads, iron condors, or strangles)
These thresholds aren't absolute rules but provide starting frameworks. Some traders use more conservative cutoffs (20% and 80%), while others adjust based on the specific underlying's volatility personality.
Additionally, compare the underlying's IV to similar securities in its sector. A stock with 50% IV Percentile might still be relatively cheap if sector peers are showing 80% IV Percentile, suggesting sector-wide elevated uncertainty that hasn't fully priced into your target.
Practical Framework: The Buy-Low / Sell-High IV Playbook
Successful IV-based trading requires systematic execution. This five-step framework transforms theoretical knowledge into repeatable process:
Step 1: Identify the IV Environment
Begin every options analysis by assessing current volatility conditions:
Check IV Percentile and IV Rank for the underlying security
Compare current IV to the stock's historical average
Identify whether any scheduled events (earnings, FDA decisions, economic releases) are approaching
Note whether IV is trending (rising, falling, or stable over recent weeks)
Most brokerage platforms display IV metrics directly on options chains. Third-party tools like Barchart, TradingView, or dedicated options platforms provide enhanced IV analytics.
Decision point: If IV Percentile is below 30%, bias toward buying options. If above 70%, bias toward selling. Between these ranges, let directional conviction guide strategy selection.
Step 2: Match the Strategy to IV Conditions
Your IV assessment determines which strategies offer the best statistical edge:
Low IV strategies (buy premium):
Long calls for bullish directional plays
Long puts for bearish directional plays
Debit spreads to reduce cost while maintaining directional exposure
Long straddles or strangles if anticipating volatility expansion without directional conviction
High IV strategies (sell premium):
Credit spreads for directional plays with defined risk
Iron condors for range-bound profit zones
Short strangles for aggressive premium collection (with higher risk)
Covered calls on existing stock positions to generate income
Neutral IV strategies:
Calendar spreads to benefit from time decay differential
Butterfly spreads for precise profit zones
Ratio spreads for experienced traders with specific volatility views
Step 3: Check Liquidity and Bid-Ask Spreads
Even the perfect IV setup fails if you can't enter and exit positions efficiently. Before committing capital, verify:
Options volume: Look for contracts trading at least several hundred contracts daily. Low volume creates execution challenges and wider spreads.
Open interest: Higher open interest (existing contracts held by traders) indicates market liquidity. Prefer strikes with open interest exceeding 500 contracts for individual stocks, higher for indices.
Bid-ask spread: The difference between the highest price a buyer will pay (bid) and the lowest price a seller will accept (ask) represents your transaction cost. For liquid underlyings, spreads should be no wider than $0.05-0.10 for options under $3.00, and less than 3-5% of the option's mid-price for more expensive contracts.
Critical point: Wide bid-ask spreads can erase theoretical edge. If the spread is $0.40 on a $2.00 option, you're immediately losing 10% of your position value to transaction costs. Pass on illiquid options regardless of IV opportunity.
Step 4: Manage Risk by Defining Maximum Loss
Never enter an options position without knowing precisely how much you can lose. This single principle prevents catastrophic account damage:
For long options: Maximum loss equals premium paid. Calculate this as a percentage of your account and never risk more than 2-5% per trade.
For credit spreads: Maximum loss equals the width of the spread minus the credit received. Example: selling a $50/$55 bull put spread for $1.50 credit creates maximum loss of $5.00 - $1.50 = $3.50 per contract, or $350 per spread.
For iron condors: Maximum loss equals the width of the widest spread minus total credit received.
For undefined-risk strategies (naked shorts, short strangles without protection): Calculate catastrophic loss scenarios. Could you survive if the stock moved 50% against you overnight? If not, restructure the trade or abandon it entirely.
Position sizing completes risk management. If maximum loss on a credit spread is $350 per contract, and you've determined you're willing to risk $500 on this trade, you can enter one contract with a buffer for slippage.
Step 5: Know When to Exit
Profitable traders manage winners and losers decisively:
Exit winning long options: Consider taking profits when:
You've captured 50-80% of the anticipated move
IV has expanded significantly, creating unrealized gains from Vega
Time decay is accelerating (within 30 days of expiration) and the position hasn't reached your target
The event that created your setup has passed
Exit winning credit positions: Plan to close when:
You've captured 50-75% of maximum profit (typical target for credit spreads)
Remaining premium is negligible compared to commission costs
IV crush has occurred following the event
Time decay has done its work and holding longer adds minimal expected return
Exit losing positions: Stop losses protect capital from catastrophic erosion:
Close long options if they've lost 50-75% of value without the thesis developing
Exit credit positions if losses reach 200% of premium collected (many traders use 2x loss as a standard stop)
Close immediately if your original thesis has been invalidated (e.g., earnings results eliminate the catalyst you expected)
Exit on event completion: When trading around scheduled events, don't hold through the event unless that's explicitly your strategy. If you sold premium into earnings IV, close the position after earnings are announced and IV has crushed, capturing your intended profit without exposing yourself to directional risk.
Example Scenarios
Hypothetical scenarios illustrate how to apply IV principles in real market conditions. All examples use fictional prices and assumptions for educational purposes.
Scenario 1: Earnings IV Crush Setup
Situation: A technology stock typically trading with 35% implied volatility now shows IV of 85% three days before quarterly earnings. IV Percentile sits at 95%, indicating extreme elevation.
Analysis: The market is pricing in substantial uncertainty about earnings results. Historical data shows this stock's IV typically falls to 30-40% within 24 hours after earnings, regardless of results.
Strategy: Sell an iron condor with strikes positioned to profit if the stock moves less than 5% in either direction. Specifically:
Sell the $95 put and $105 call (roughly 5% from current price of $100)
Buy the $92 put and $108 call for protection
Collect $1.25 credit per contract with $3.00 maximum risk
Outcome considerations: If the stock stays between $95-105 after earnings and IV crushes back to 35%, the position profits from both theta decay and Vega contraction. If earnings trigger a move beyond the profitable range, maximum loss is $300 - $125 = $175 per contract.
Risk management: Position size to risk no more than 2% of account value. Set stop loss if position reaches $250 loss per contract before earnings. Close remaining value after earnings announcement regardless of profit level to avoid weekend risk.
Scenario 2: Quiet Market Breakout Potential
Situation: A large-cap index ETF has been consolidating in a tight range for six weeks. IV has declined to 15%, showing IV Percentile of just 18%—near its annual low. Technical analysis suggests the consolidation may be forming a continuation pattern before a significant move, but direction remains unclear.
Analysis: IV is statistically cheap, making long options attractive. However, directional uncertainty suggests a strategy that profits from movement in either direction rather than a pure directional bet.
Strategy: Buy a long straddle, purchasing both the at-the-money call and at-the-money put:
Buy the $400 call for $3.50
Buy the $400 put for $3.20
Total investment: $6.70 per straddle, or $670 per contract pair
Profit requirement: The ETF must move approximately $6.70 beyond breakeven strikes ($393.30 or $406.70) by expiration for the trade to profit at expiration. However, if volatility expands before expiration, both legs gain value from positive Vega exposure.
Outcome considerations: If the consolidation breaks and IV jumps from 15% to 25%, the position could show profit even with modest price movement due to volatility expansion across both legs. If the range continues and IV remains suppressed, time decay will erode the position daily.
Risk management: Select expiration 60-90 days out to provide adequate time for the thesis to develop. Set maximum loss at 50% of premium paid if consolidation persists beyond 30 days without IV expansion.
Scenario 3: Elevated IV Before Macro Events
Situation: Federal Reserve interest rate decision scheduled in one week has driven broad market IV higher. An S&P 500 ETF normally trading with IV of 18% now shows 28% IV, with IV Percentile at 73%.
Analysis: Market-wide uncertainty has inflated premiums across all options. Historical precedent shows Fed decisions typically produce initial volatility that quickly subsides as uncertainty resolves.
Strategy: Sell credit spreads to capitalize on elevated premium:
Bearish thesis: Sell a bear call spread by selling the $430 call and buying the $435 call for $1.20 credit
Bullish thesis: Sell a bull put spread by selling the $420 put and buying the $415 put for $1.15 credit
Outcome considerations: If the ETF remains below $430 (for the call spread) or above $420 (for the put spread) through Fed decision and subsequent IV decline, the position profits from both theta decay and volatility contraction. Maximum loss is $380 per spread ($5.00 width - $1.20 credit).
Risk management: Place one spread in the direction matching your broader market outlook rather than selling both sides simultaneously (which would create an iron condor with higher risk exposure around the Fed decision). Close the position within 48 hours after the Fed announcement once IV has normalized, regardless of profit status, to avoid holding duration risk.
Scenario 4: Post-Event IV Normalization
Situation: A pharmaceutical company received FDA approval yesterday for a key drug candidate. Prior to approval, IV was 120% (IV Percentile 98%). Following the positive news and a 15% gap higher in the stock price, IV has collapsed to 45% (IV Percentile 35%), but remains moderately elevated as the market digests implications.
Analysis: The binary event risk has resolved, causing dramatic IV crush. However, IV remains above historical norms, suggesting premiums haven't fully normalized. The stock may enter a quieter consolidation phase as the approval news is absorbed.
Strategy: Initiate a long position anticipating further IV decline combined with directional consolidation:
Sell a bull put spread with strikes well out-of-the-money to collect remaining elevated premium
Sell the $85 put and buy the $80 put for $0.90 credit (current stock price $100)
Outcome considerations: As IV continues declining toward the stock's typical 30-35% range and time passes without the stock falling more than 15%, the spread retains most of its value and can be closed for 75% of maximum profit.
Risk management: This scenario demonstrates that elevated IV doesn't necessarily mean "sell immediately." Understanding the narrative and event timeline allows for strategic entries even after partial IV crush has occurred. The out-of-the-money strikes provide substantial cushion against downside correction.
Common Mistakes Traders Make With IV
Understanding implied volatility theory doesn't guarantee success. Traders consistently make predictable errors that undermine otherwise sound strategies:
Mistake 1: Confusing IV With Direction
The most fundamental error is interpreting high IV as a bullish or bearish signal. IV measures expected magnitude of price change, not direction. A stock can have extremely high IV and remain completely flat, or have low IV and make substantial moves.
When IV spikes before earnings, it reflects uncertainty about results—not consensus about positive or negative outcomes. Traders who buy calls simply because IV is high are paying inflated premiums for directional exposure with no statistical edge.
Correction: Use IV to determine whether to buy or sell options, then apply separate directional analysis (technical, fundamental, or sentiment-based) to choose which specific strategy (calls vs puts, call spreads vs put spreads) to implement.
Mistake 2: Misjudging Event Volatility
Many traders sell options into earnings or other events, correctly identifying elevated IV, but fail to account for the magnitude of potential moves. Collecting $2.00 in premium seems attractive until the stock gaps $15 against your position.
Historical move analysis is essential. If a stock typically moves 8-12% on earnings, selling credit spreads with strikes only 5% away offers inadequate probability of success regardless of premium collected.
Correction: Before selling into events, research the underlying's typical post-event moves. Use options market-implied moves (calculated from straddle prices) to gauge expected range. Position strikes beyond these implied ranges, accepting lower premium for higher probability of success.
Mistake 3: Underestimating Vega Risk
Traders who buy options in elevated IV environments often experience frustration when "their direction was right but they still lost money." This occurs when IV crush offsets favorable price movement.
Buying a call before earnings with IV at 80%, watching the stock rise 3% after earnings, then seeing the option lose value as IV collapses to 35% teaches expensive lessons about Vega risk.
Correction: Calculate the Vega exposure of your position. If you're buying options, accept you need either substantial directional movement or sustained elevated IV to profit. Don't buy into events unless you expect volatility to remain elevated or expand further. Consider alternatives like debit spreads, which reduce Vega sensitivity by offsetting some volatility exposure.
Mistake 4: Selling Options With Too Little Premium
Seeing that IV is "high" relative to history doesn't automatically make selling worthwhile. If high IV only generates $0.30 in premium for a $5-wide credit spread, the risk-reward is unattractive. You're risking $470 to make $30—terrible odds even with reasonable probability of success.
Correction: Establish minimum premium thresholds for short options strategies. Many professional traders require at least $0.75-1.00 credit per $5 spread width, or 15-20% of the spread width as premium. If IV isn't elevated enough to generate this threshold, skip the trade.
Mistake 5: Ignoring the Full Options Chain
Focusing exclusively on at-the-money options while ignoring wings of the options chain creates blind spots. Sometimes elevated IV manifests primarily in certain strikes (particularly far out-of-the-money), while other strikes show normal pricing.
This "volatility skew" reflects market participants pricing different probabilities for various outcomes. Ignoring skew means missing either opportunities (underpriced wings) or risks (expensive protection indicating informed concerns).
Correction: Review the entire options chain before trading. Compare IV across multiple strikes and expirations. Understand whether elevated IV is uniform or concentrated in specific areas. This broader perspective reveals whether the market is pricing general uncertainty or specific directional concerns.
Mistake 6: Trading Without Sufficient Time
Buying options with only 2-3 weeks until expiration magnifies both opportunity and risk. While short-dated options are cheaper in absolute terms, they provide minimal time for your thesis to develop and face extreme theta decay.
Unless you expect immediate catalyst realization, short-dated options rarely offer positive expected value, particularly in low IV environments where the entire thesis depends on volatility expansion.
Correction: For most directional trades, select options with 45-90 days until expiration. This provides adequate time for movement while avoiding the excessive cost of long-dated options. For IV expansion plays, ensure sufficient time exists for market conditions to shift. Accept higher absolute costs as the price of probability.
Mistake 7: Failure to Define Exit Strategy
Entering positions without predetermined exit criteria leads to emotional decision-making under pressure. Traders hold losing positions hoping for recovery, or close winning positions prematurely from fear of giving back gains.
Correction: Before placing any trade, document specific exit conditions: profit target (often 50-75% of maximum profit for credit spreads), maximum loss tolerance (typically 2x premium collected for credit spreads, 50-75% of premium paid for debit positions), and time-based exits (close all positions 7-14 days before expiration if they haven't reached profit targets). Execute these exits mechanically regardless of short-term emotion.
Conclusion
Implied volatility transforms options trading from speculation into strategic timing. By mastering the relationship between IV levels and premium pricing, you gain the essential insight needed to consistently identify opportunities: purchasing statistically cheap options when IV is compressed, selling statistically expensive options when IV is elevated.
The frameworks presented here—comparing current IV to historical ranges using IV Percentile and IV Rank, matching strategies to volatility environments, managing Vega exposure, and executing disciplined risk management—provide the foundation for sustainable success. Options are neither inherently risky nor inherently safe. How you deploy them, guided by IV analysis and structured execution, determines whether they serve as precision instruments for managing opportunity or reckless instruments for amplifying losses.
Begin implementing IV-based timing in your own trading with modest position sizes, strict risk controls, and continuous learning. Track every trade's IV environment at entry and exit, documenting which conditions produced profits and which generated losses. Over time, pattern recognition sharpens, and the optimal moments to act become increasingly clear.
Remember that no timing signal guarantees success. Markets are probabilistic systems where correct analysis leads to favorable odds, not certain outcomes. Embrace this reality through proper position sizing, diversification across multiple uncorrelated positions, and acceptance that occasional losses are the price of participating in positive expected-value strategies.
Options trading offers extraordinary versatility for those willing to study the mechanics thoroughly. The IV principles covered here represent core professional knowledge that separates consistent traders from those who treat options as lottery tickets. Apply these concepts with discipline, intellectual honesty about your edge, and unwavering commitment to risk management.
Explore more advanced options strategies, risk management frameworks, and market analysis at OraniaTech.com—your resource for professional-grade financial education
Risk Disclaimer
Options trading involves substantial risk and is not suitable for all investors. The strategies and scenarios presented in this article are for educational purposes only and do not constitute investment advice, recommendations, or solicitation to buy or sell securities. All examples use hypothetical prices and outcomes that may not reflect actual market conditions.
Past performance does not guarantee future results. Options can expire worthless, resulting in total loss of premium paid. Selling options may involve unlimited risk exposure if positions